
The accuracy of the data collected by ultrasound instruments is
paramount in the interpretation and diagnostic utilization of the information collected.
ICAVL Standards for Accreditation
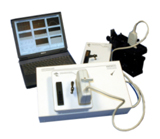
Sound Decision Transducer Testing Tool
Sound Decision Uses Objective QC Technology
Sound Decision makes use of the latest probe testing technology, the same type of testing done in the factory. The acoustic and electrical tests reveal the true source of transducer performance and safety problems such as:
(1) the number and location of dead acoustic elements across an array,
(2) elements that have reduced sensitivity which can contribute to poor imaging quality, lower color flow or Doppler sensitivity,
(3) acoustic lens de-lamination, a condition which often results in image drop-out, potential electrical safety issues and long term destruction of the array,
(4) broken signal wires or cable termination issues within the transducer, cable, or connector.
The combination of these data provides the operator with the information needed to differentiate between suspected system problems and performance problems with a transducer.
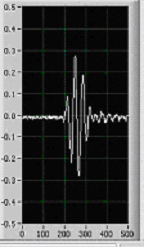
Sensitivity: Element Sensitivity is a measure of the relative response of the individual crystals within the array. There should only be minor variations in signal amplitude of any given crystal within a fully functional array. Ideally, the impulse response of each transducer element of an array should be identical. Identical array element response would give rise to the best spatial impulse response afforded by a particular beam-former design. Unfortunately, perfectly matched array elements cannot be constructed. Therefore variations will exist as shown The sensitivity is displayed as a bar graph of the returning echo intensity. The sensitivity graph should display a uniform intensity across the array. Variations are not, however uncommon for older transducers. Signal reductions of more that 20% are indications of weak elements. These probes will produce lower quality Doppler and Color Flow results.
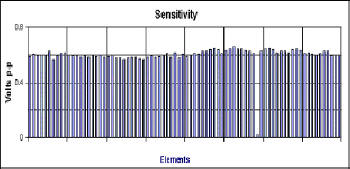 |
Low sensitivity elements can also adversely effect the B-Mode image quality by a reduction in the signal to noise and poor beam focusing that directly reduces the lateral resolution.
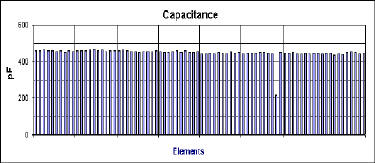
Capacitance: This is a measure of the electrical performance of each individual element's circuit. The acoustic array is, by nature, a capacitor. Higher frequency probes such as 7.5 MHz and above are usually smaller arrays and thus, have lower capacitance, (approx. 50 pF). Lower frequency probes such as 3.5 Curved Arrays usually have larger elements, and thus higher capacitance, (approx 350 pF). The cable also has capacitance. The standard ultrasound cable used on probes over 2 years old was typically 120 pF per meter. The newer probe designs often make use of "low-cap" cable that is typically 85 pF per meter. It is important to know how to read the capacitance graph in order to diagnosis a broken cable, cracked array element, or connector problem. Very high capacitance is a sign of a short circuit. A short can occur anywhere along the length of the cable or in the array itself.
|
At 220 pF, the cap test clearly shows that the element is dead. If the capacitance was near zero, the wire would be open in the connector. If the capacitance was higher than for other elements, it would indicate a short somewhere in the circuit. |
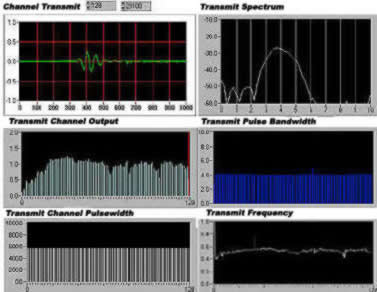
Pulse-Width: The length of the returned echo pulse is an indication of the "health" of the acoustic stack bonding. A longer transducer pulse-length can be the source of poor axial resolution. The longer pulse lengths can also cause a mis-registration of the color flow overlay.
The -20dB pulse width is a very important imaging parameter as it has the greatest impact upon the contrast sensitivity of the B-mode image. The pulse width is a function of the transducer center frequency and bandwidth.
 |
The length of the returning echo is measured in nano-seconds. This is an objective and reproducible measurement of axial resolution |
Pulse Length- The length of the returned echo pulse is an indication of the "health" of the acoustic stack bonding. A longer transducer pulse-length can be the source of poor axial resolution. The longer pulse lengths can also cause a mis-registration of the color flow overlay.
The -20dB pulse width is a very important imaging parameter as it has the greatest impact upon the contrast sensitivity of the B-mode image. The pulse width is a function of the transducer center frequency and bandwidth.
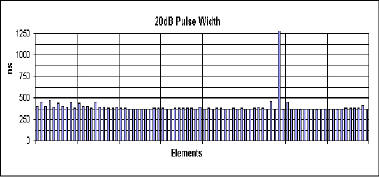
Notice that this damaged element is flanked by 2 other elements with longer than average pulse widths. Dead (cracked) elements often set the stage for other adjacent elements to follow in kind. |
Since the element is dead, the pulse width is very long because the transmit signal is not terminated. |
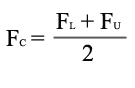
Center Frequency - The center frequency is the mid-point of the Pulse Spectrum. The center frequency graph should be uniform across the array. In a narrow-band array the center frequency is the highest point located on the particular transducers response curve. In broadband probes, the center frequency is better calculated using the formula:
 |
|
where FL is the lower -3dB point, and FU the upper - point |
Frequency Spectrum - This is a graphical image of the frequency response curve. Page 3 of the report displays the frequency spectrum for 3 selected elements. The Frequency Spectrum is useful in determining the source of image quality or Doppler sensitivity issues.
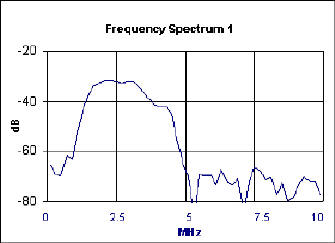 |
The actual sensitivity band pass of the probe is easy to see using the frequency spectrum display. |
Fractional Bandwidth - This is a key parameter for system performance. This performance parameter is closely related to the overall dynamic range of the ultrasound system, i.e., it would not make sense to have an array with a bandwidth that could not be processed due to limitations of the system. Most modern ultrasound probes, especially those on "high cost" systems are generally above 60% bandwidth. There are some companies who have achieved greater than 80% bandwidth in volume production
The bandwidth (BW) of the array can be defined as:
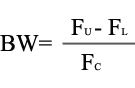 |
where FL is the lower -3dB point, and FU the upper -3dB point |
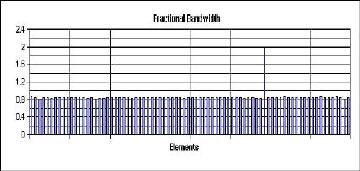
It also improves Doppler sensitivity. Low Fractional Bandwidth readings can be attributed to the poor design of a clone probe. |
Modern transducers have bandwidth specification of >50%. This allows a user to optimize the image for either resolution or penetration. |
Defining Acceptance Criteria
The acceptance criteria for dead elements or open cables is a straight forward process. However, an acceptance criteria for marginal transducers is a different story. When using the printed test report, always evaluate the results against your established transducer acceptance criteria.
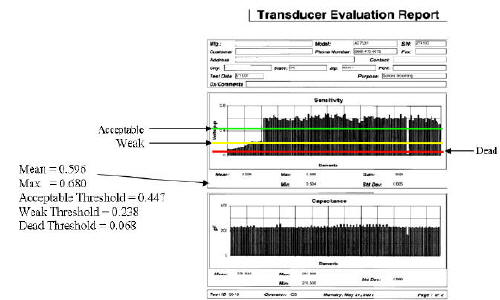
Examples of the Sound Decision definitions of acceptable, weak, and dead elements. Refer to the figure below and the table below as an example of the test result acceptance criteria.
1) Functionally Acceptable - an individual element that operates at a minimum of 75% of that of the mean value of all elements within a given array that has fewer than an aggregate of four dead elements, but no consecutive dead elements.
2) Weak Element - an individual element that operates at less than 75%, but higher than 40% of that of the mean value of all elements within a given array that has fewer than an aggregate of four dead elements, but no consecutive dead elements.
3) Dead Element a-n individual element that operates at less than 10% of that of the element with the highest sensitivity value measured within a given array in the absence of a de-lamination of the lens.
Contact Information
Telephone: 425-837-0400
Address: 21107 SE 28th Place, Sammamish, WA 98075
E-mail: Information